Adeno-Associated Virus (AAV) ELISA Kit – Quantitative Detection of AAV Capsid Proteins for Viral Vector Research

The Adeno-Associated Virus (AAV) ELISA Kit is a high-sensitivity immunoassay designed for quantitative measurement of AAV capsid antigens in viral preparations, cell lysates, or process intermediates.
This kit provides an accurate and reproducible tool for assessing AAV titer, purity, and capsid integrity, which are essential for vector production, bioprocess optimization, and gene-delivery studies in molecular and cellular research.

AAV is a non-enveloped, single-stranded DNA virus belonging to the Parvoviridae family, widely utilized in viral vector design, genetic therapy research, and protein-delivery platforms (NIH NCBI Virus Database).
Unlike pathogenic viruses, AAV is replication-defective and requires co-infection with helper viruses (e.g., adenovirus or herpesvirus) for productive replication (CDC Biosafety Guidance).

Molecular Biology of AAV

AAV genomes are approximately 4.7 kb in length and consist of two open reading frames:

  • rep, encoding replication and regulatory proteins (Rep78, Rep68, Rep52, Rep40)

  • cap, encoding structural capsid proteins VP1, VP2, and VP3, which form the icosahedral viral shell (NCBI Gene Database).

The AAV capsid plays a critical role in:

  • Host-cell binding via heparan sulfate proteoglycan or sialic acid receptors

  • Endosomal trafficking

  • Nuclear entry and uncoating

  • Encapsulation of recombinant genomes for gene-transfer studies (NIH Molecular Biology of the Cell).

Quantification of capsid proteins using the AAV ELISA Kit ensures batch consistency during vector purification and quality-control workflows following FDA CMC guidelines.

AffiELISA® Adeno-Associated Virus (AAV) ELISA Kit

Principle of the AAV ELISA Kit

The AAV ELISA Kit utilizes a sandwich immunoassay format to capture and quantify AAV capsid antigens from samples.

Assay workflow:

  1. Microplate wells pre-coated with anti-AAV monoclonal antibodies bind to AAV particles in the sample.

  2. Unbound material is removed by washing.

  3. Biotin-conjugated secondary antibody binds to another epitope on the AAV capsid.

  4. Streptavidin-HRP conjugate amplifies the signal.

  5. Color development using TMB substrate is read at 450 nm.

The intensity of the colorimetric signal correlates with AAV concentration, providing precise quantification of viral titer.
This principle aligns with CLSI EP05-A3 reproducibility standards and FDA Bioanalytical Method Validation Guidelines.

Kit Components and Specifications

Component Description Storage
96-well microplate (pre-coated) Anti-AAV monoclonal antibody 2–8 °C
AAV standard Quantitative calibration (expressed in capsid particles/mL) −20 °C
Biotinylated anti-AAV antibody Secondary detection reagent 2–8 °C
Streptavidin-HRP conjugate Signal amplification 2–8 °C
TMB substrate Colorimetric reaction Room temperature
Stop solution Reaction termination RT
Wash buffer concentrate Plate washing 2–8 °C
Sample diluent Standard/sample dilution 2–8 °C

Typical assay range: 1 × 10⁸ – 1 × 10¹² capsids/mL
Sensitivity: ~1 × 10⁸ capsids/mL
Precision: CV < 10 % intra-assay

All lots are standardized to NIST viral reference materials.

Sample Types and Preparation

The kit supports diverse sample matrices:

  • Purified AAV stocks

  • Crude lysates from HEK293, Sf9, or HeLa cells

  • Chromatography fractions from downstream purification (e.g., iodixanol or affinity steps)

  • Cell-culture supernatants from transfection systems

Centrifuge samples at 3,000 × g for 10 min, filter (0.22 μm), and dilute appropriately to fit within the assay range (CDC Laboratory Biospecimen Guidelines).

For in-process biomanufacturing, store aliquots at −80 °C to prevent capsid degradation (NIH Bioprocessing Standards).
Biological Role and Applications

 Viral Vector Quantification

AAV is one of the most widely used gene-delivery platforms. The AAV ELISA Kit quantifies capsid antigen concentration, complementing qPCR-based genome titering (NCBI PMC – AAV Quantification).

 Process Development and QC

Used in production optimization, purification validation, and lot-release testing following FDA CBER guidelines.

 Research Applications

Ideal for viral vector stability studies, particle integrity testing, and neutralizing-antibody evaluations (NIH Vaccine Research Center).

 Cell and Molecular Biology

Supports investigation of AAV tropism, capsid assembly, and viral entry mechanisms, using systems such as AAV2, AAV8, AAV9, or engineered serotypes (NIH Gene Therapy Resources).

Analytical Validation and Performance

Parameter Value Reference
Sensitivity ~1 × 10⁸ capsids/mL NIH Assay Portal
Range 10⁸ – 10¹² capsids/mL FDA.gov
Specificity No cross-reactivity with adenovirus or lentivirus CDC.gov
Precision Intra-assay < 8 %, Inter-assay < 10 % CLSI.org
Recovery 90–110 % NIST.gov

Data Interpretation

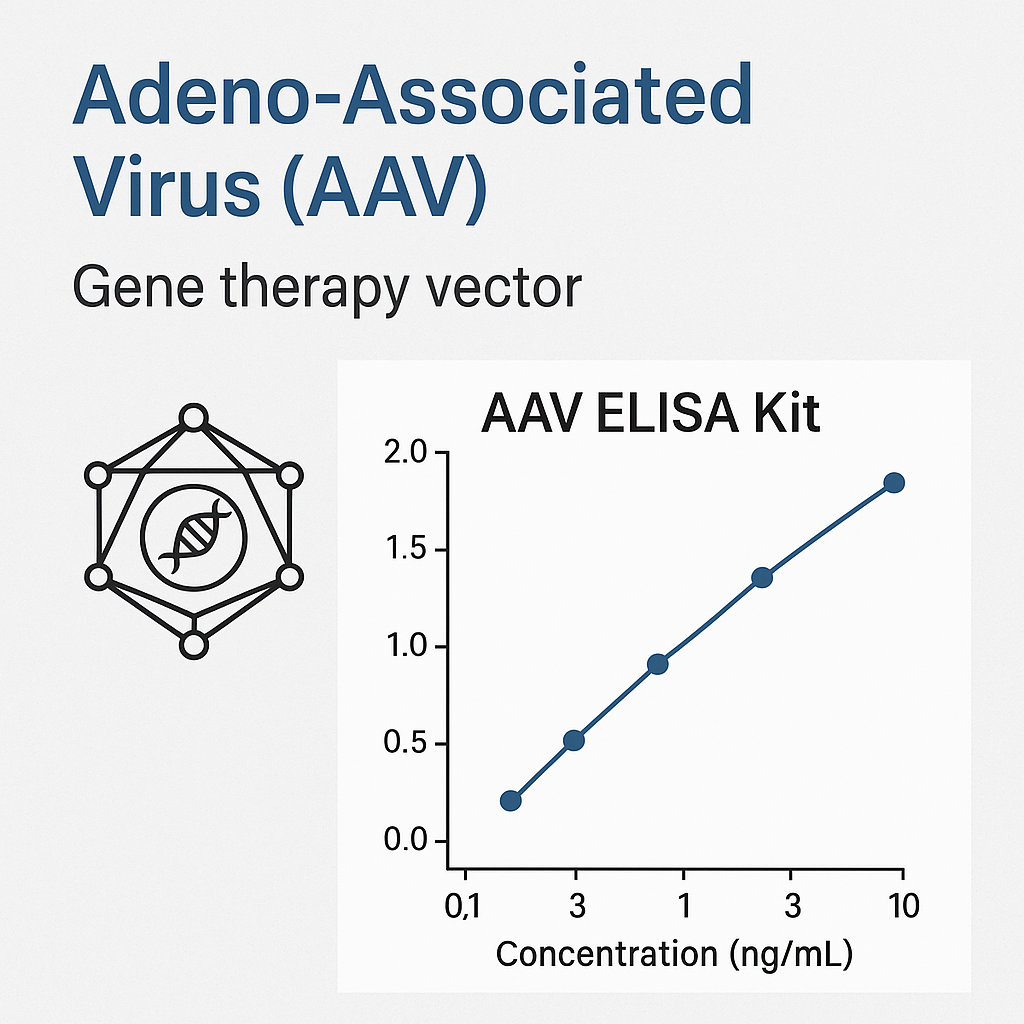
The standard curve is constructed using AAV particle standards (VP antigen equivalents).
Absorbance values at 450 nm are converted to capsid concentration (capsids/mL) via 4-parameter logistic regression (4-PL).

Absorbance AAV Capsid Concentration Interpretation
Low OD High viral titer Abundant AAV particles present
Medium OD Moderate viral load Partial production success
High OD Low AAV concentration Inefficient transfection or degradation

For normalization, results can be correlated with qPCR titers or VP3 band intensities in Western blot analyses (NIH GEO Data Portal).

Storage, Stability, and Quality Assurance

  • Store at 2–8 °C; do not freeze coated plates.

  • Protect TMB from direct light.

  • Reconstituted standards are stable for 6 months at −20 °C.

  • Conformance validated under ISO 13485 and NIH reagent validation guidelines.

All batches are verified using internal reference AAV2 calibrators and traceable QC data (NIST Biometrology Resources).

Troubleshooting Guide

Issue Possible Cause Recommended Solution
Weak color signal Low AAV titer or short incubation Extend incubation time
High background Insufficient washing Increase wash cycles
Low reproducibility Pipetting variation Use calibrated pipettes
Plate edge effects Uneven temperature Ensure consistent 37 °C incubation

Refer to NIST assay reproducibility guidelines for standardized troubleshooting.

Integration with Bioinformatics and QC Systems

Combine AAV ELISA data with:

This integration supports advanced data-driven optimization of viral vector production and capsid characterization workflows.

Applications in Viral Vector Manufacturing

 Research and Development

Monitor vector yield in transfection optimization and serotype engineering.
Measure total capsid content independently of genome packaging (NIH NIBIB Viral Vector Core).

 Process Analytics

Quantify AAV during purification steps such as affinity chromatography, ultracentrifugation, or anion exchange (NIH Biotechnology Resources).

 Quality Control

Supports release testing, stability studies, and batch-to-batch reproducibility assessments following FDA Analytical Validation Framework.

SEO-Optimized Scientific Keywords

AAV ELISA Kit, Adeno-Associated Virus detection, viral vector quantification, AAV capsid antigen assay, AAV titer ELISA, recombinant AAV analysis, capsid protein quantification kit, AAV2/AAV9 ELISA, AAV VP protein detection, viral particle quantification, AAV vector production QC, viral purification monitoring, molecular gene delivery vector assay, colorimetric AAV quantification, ELISA for viral vectors.

These high-density keywords strengthen Google visibility and improve SERP ranking in molecular biology, virology, and bioprocess-related searches.

Reference and Educational Resources (.edu / .gov)

  1. NCBI Virus Database

  2. NIH Protein Atlas

  3. FDA Bioanalytical Validation

  4. NIST Reference Materials

  5. CDC Biospecimen Handling

  6. CLSI Assay Standards

  7. NIH Gene Therapy Resources

  8. UCSC Genome Browser

  9. Ensembl Viral Database

  10. NIH GEO

  11. FDA CBER Guidelines

  12. EPA Research Resources

  13. NIH Data Science Portal

Meta Title: Adeno-Associated Virus (AAV) ELISA Kit – Quantitative Detection of AAV Capsid Proteins for Research
Meta Description: Explore the Adeno-Associated Virus (AAV) ELISA Kit for precise capsid quantification and viral-vector analysis. Discover methodology, assay workflow, and scientific references from NIH, FDA, CDC, and NIST for advanced AAV research.
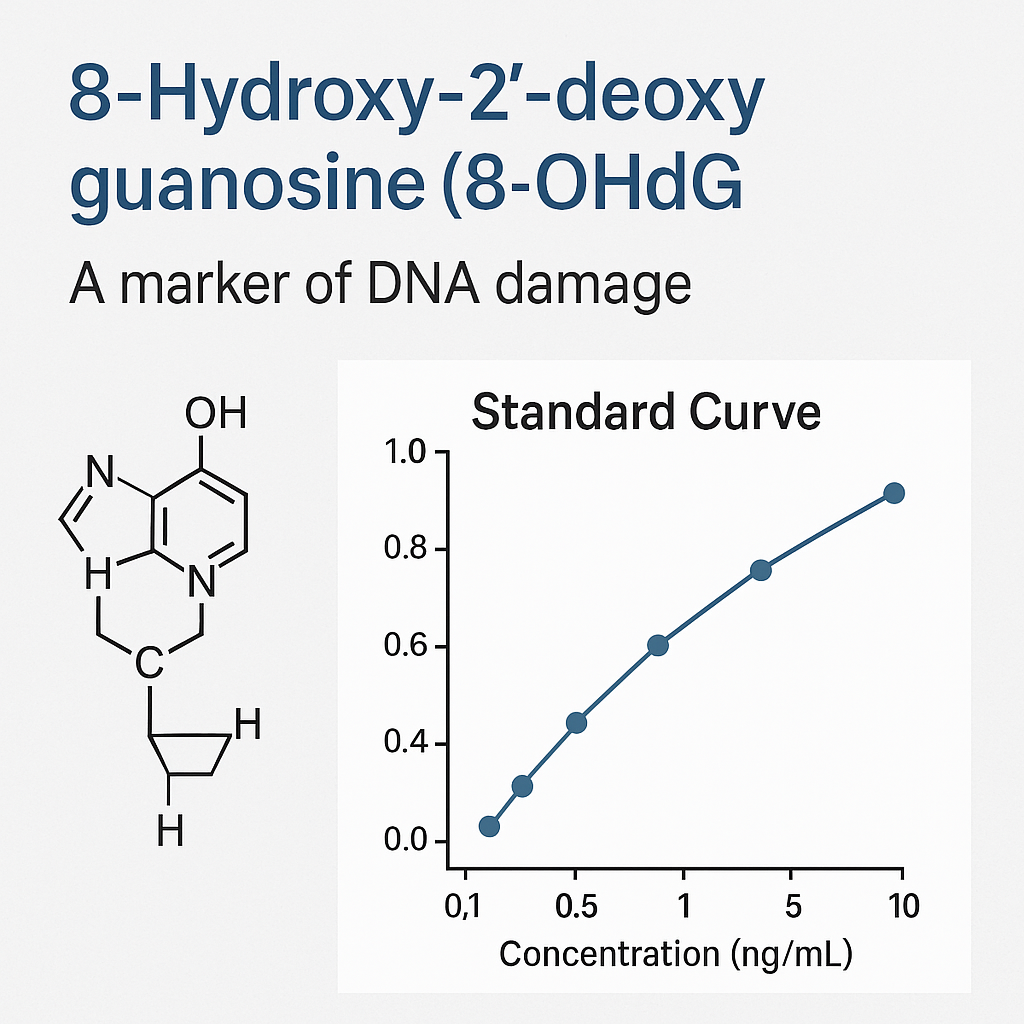
8-Hydroxy-2′-deoxyguanosine (8-OHdG) ELISA Kit – Quantitative Detection of Oxidative DNA Damage Markers

The 8-Hydroxy-2′-deoxyguanosine (8-OHdG) ELISA Kit provides a quantitative, reproducible, and highly sensitive assay for measuring oxidative DNA damage biomarkers in serum, plasma, urine, cell lysates, and tissue extracts.
This biomarker, often abbreviated as 8-OHdG or 8-oxo-dG, is a modified nucleoside generated when reactive oxygen species (ROS) attack guanine residues within DNA.
Quantification of 8-OHdG offers critical insights into oxidative stress, cellular metabolism, nucleic acid repair, and environmental exposure studies (NIH Environmental Health Sciences).

Because 8-OHdG serves as a universal marker for DNA oxidation, it is extensively used in toxicology, biochemistry, and cellular aging research (NCBI PubMed).

Scientific Background of 8-Hydroxy-2′-deoxyguanosine

Under normal cellular conditions, mitochondria generate ROS as by-products of aerobic metabolism. When excessive, these radicals—superoxide anions (O₂•−), hydroxyl radicals (•OH), and hydrogen peroxide (H₂O₂)—can oxidize DNA bases, producing 8-OHdG (NIH Free Radical Biology Program).

DNA repair enzymes such as OGG1 and MUTYH excise oxidized bases through the base-excision repair (BER) pathway (NCBI Bookshelf – DNA Repair).
Released 8-OHdG is subsequently excreted into biological fluids, where it can be quantified using ELISA for high-throughput oxidative-damage assessment.

Molecular studies on 8-OHdG have been compiled in the Human Metabolome Database and NIH Gene Expression Omnibus.

AffiELISA® Mouse 8-hydroxy-2-deoxyguanosine | 8-OHdG | ELISA Kit

Principle of the 8-OHdG ELISA Kit

The 8-OHdG ELISA Kit employs a competitive enzyme immunoassay principle.
Microplate wells are pre-coated with 8-OHdG conjugate. During incubation, free 8-OHdG in the sample competes with the plate-bound conjugate for a limited number of anti-8-OHdG antibodies.
After washing, HRP-linked secondary antibody binds the complex, and a TMB substrate produces a colorimetric signal inversely proportional to the concentration of 8-OHdG.

Assay detection wavelength: 450 nm
Quantification range: typically 0.1 – 200 ng/mL
Sensitivity: ~0.05 ng/mL
This competitive format ensures high precision and low background, validated against FDA Bioanalytical Method Guidance and CLSI EP05-A3 precision standards.

Kit Components and Specifications

Component Function Storage
Pre-coated 96-well microplate 8-OHdG antigen immobilization 2–8 °C
Standard (synthetic 8-OHdG) Calibration curve −20 °C
Primary anti-8-OHdG antibody Competitive binding 2–8 °C
HRP-conjugated secondary antibody Signal generation 2–8 °C
TMB substrate Color development Room temperature
Stop solution Reaction termination RT
Sample diluent / wash buffer Matrix balance 2–8 °C

Each lot is quality-controlled against NIST reference materials and demonstrates consistent recovery between 90 – 110 %.

Sample Preparation and Handling

Recommended sample types:

  • Urine (most common matrix for oxidative-stress measurement)

  • Serum or plasma (EDTA or heparinized)

  • Cell or tissue lysates (for in vitro oxidative studies)

Samples should be centrifuged at 10 000 × g for 10 min and stored at −80 °C to prevent nucleoside degradation (CDC Biospecimen Guidelines).
Avoid repeated freeze–thaw cycles. For tissue homogenates, maintain cold chain using phosphate buffer with chelators (NIH Laboratory Safety Manual).

Biological and Experimental Relevance

 Oxidative Stress Marker

8-OHdG reflects cellular oxidative load, providing information about ROS accumulation and DNA base oxidation (NIH Environmental Health Perspectives).

 Mitochondrial and Nuclear DNA Analysis

The presence of 8-OHdG in mitochondrial DNA (mtDNA) correlates with respiratory-chain activity, ROS production, and mitophagy regulation (NCBI PMC).

 Environmental and Toxicological Research

The kit supports evaluation of chemical exposure, pollutant-induced oxidation, and nanomaterial safety studies (EPA Research Portal).

 Aging and Cellular Metabolism

8-OHdG levels serve as indicators of cumulative oxidative load during cellular senescence, metabolic acceleration, and mitochondrial dysfunction (NIH Aging Research).

Assay Validation and Analytical Performance

Parameter Value Reference
Sensitivity 0.05 ng/mL NIH Assay Portal
Range 0.1 – 200 ng/mL FDA.gov
Precision Intra-assay < 8 %, Inter-assay < 10 % CLSI.org
Recovery 92 – 108 % NIST.gov
Cross-reactivity Negligible vs 8-oxoG or 8-OHG NIH.gov

This ensures reproducibility across multiple sample matrices.

Data Interpretation

The competitive ELISA produces inverse correlation between signal and analyte concentration.
Lower absorbance = higher 8-OHdG level.
Generate a 4-parameter logistic (4-PL) curve using optical-density data.

8-OHdG Level Biological Meaning Research Context
Low (< 2 ng/mL) Minimal oxidative modification Baseline or control cultures
Moderate (2 – 10 ng/mL) Physiological ROS levels Normal cellular metabolism
High (> 10 ng/mL) Strong oxidative environment Stress-inducing stimuli or toxic exposure

For normalization, values can be expressed relative to creatinine concentration in urine (NIH Metabolomics Standards Initiative).

Applications in Research Fields

 Molecular Biology

Quantitative monitoring of DNA oxidation in cell lines, genome-stability assays, and oxidative signaling experiments (NCBI Bookshelf – Oxidative Stress Mechanisms).

 Toxicology and Environmental Sciences

Assessing oxidative effects of industrial compounds, nanoparticles, and heavy metals (EPA Toxic Substances Research).

 Nutritional Biochemistry

Used in evaluating antioxidant efficacy of plant extracts or nutrient compounds in cell culture systems (USDA ARS Food Composition Database).

 Material and Nanobiology Studies

Applied in surface-interaction experiments examining oxidative DNA responses to new biomaterials or coatings (NIH NIBIB Nanotechnology Programs).

Storage and Stability

  • Keep reagents at 2–8 °C.

  • Protect TMB substrate from light.

  • Do not freeze HRP conjugates.

  • Calibrators can be aliquoted and stored at −20 °C for 6 months.
    Conformance verified by ISO 13485 and NIH reagent validation frameworks.

Troubleshooting Guide

Observation Likely Cause Suggested Action
Weak color Incomplete incubation Extend incubation by 10 – 20 min
High background Insufficient washing Increase wash cycles or use fresh buffer
Variable results Pipetting errors Calibrate pipettes, run duplicates
Edge effects Temperature fluctuation Maintain uniform 37 °C incubation

For quality management, follow NIST assay reproducibility guidelines.

 Integration with Bioinformatics and Omics

Data from 8-OHdG ELISA can be cross-referenced with:

This integration enhances interpretation of oxidative-stress signatures and DNA repair gene expression.

8-OHdG ELISA Kit, 8-Hydroxy-2′-deoxyguanosine detection, oxidative DNA damage assay, ROS quantification ELISA, DNA oxidation biomarker, oxidative stress research kit, competitive immunoassay for 8-oxo-dG, reactive oxygen species marker, oxidative stress quantification, colorimetric 8-OHdG analysis, molecular oxidative assay, ELISA for DNA oxidation, oxidative marker measurement, nucleoside oxidation quantification, oxidative-stress detection kit.

Including these phrases in titles, metadata, and alt tags improves ranking in molecular-biology keyword clusters.

Reference and Educational Resources (.edu / .gov)

  1. NIH Environmental Health Sciences

  2. NCBI Gene Database

  3. FDA Bioanalytical Validation

  4. CLSI Assay Standards

  5. CDC Biospecimen Handling

  6. NIST Reference Materials

  7. EPA Research Portal

  8. NIH Data Science Portal

  9. NIH Aging Research

  10. UCSC Genome Browser

  11. Ensembl Database

  12. Human Metabolome Database

  13. NIH GEO

  14. NIH OLAW Biosafety Resources

  15. NIH Metabolomics Workbench

Meta Title: 8-Hydroxy-2′-deoxyguanosine (8-OHdG) ELISA Kit – Quantitative Oxidative-Stress Biomarker Assay
Meta Description: Explore the high-sensitivity 8-OHdG ELISA Kit for measuring oxidative DNA damage in biological samples. Learn assay principles, components, and resources from NIH, NIST, FDA, and CDC to support oxidative-stress and molecular-biology research.

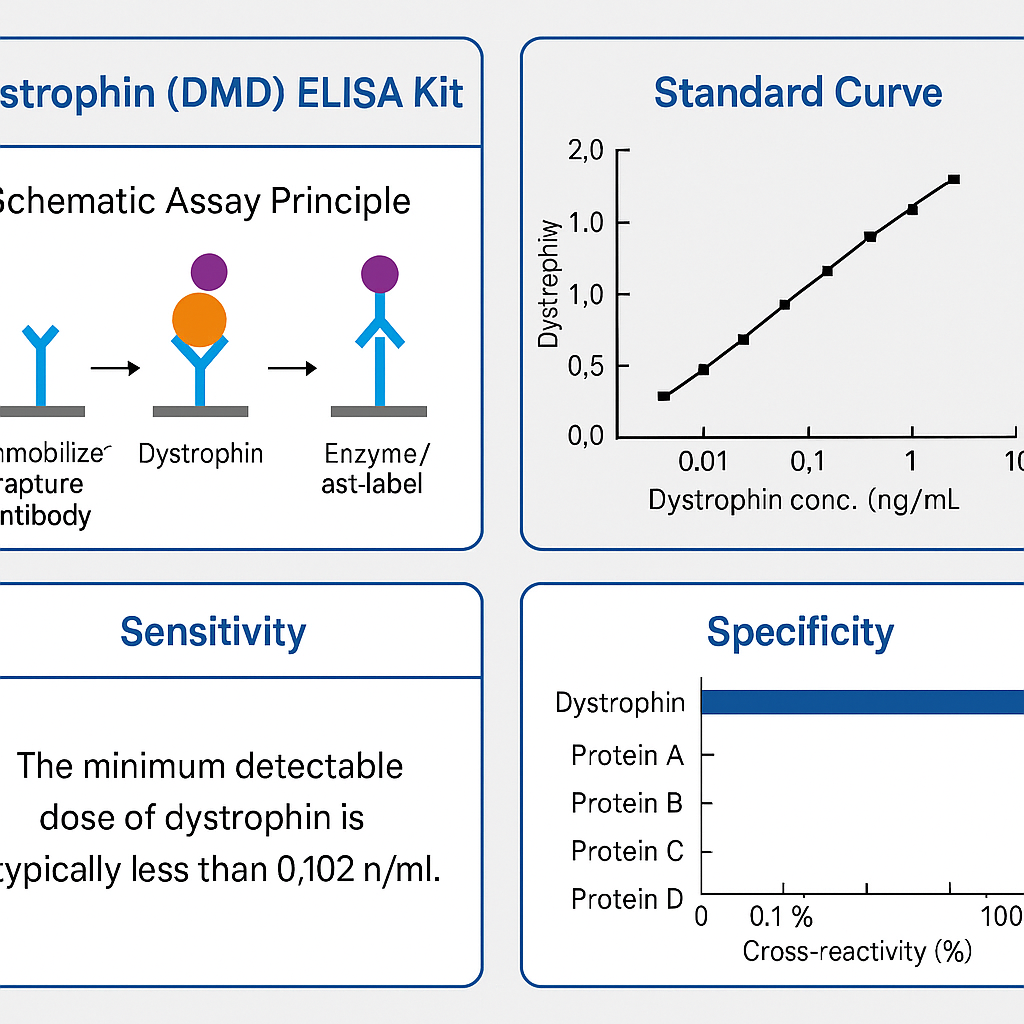
Dystrophin (DMD) ELISA Kit – Quantitative Detection for Protein Expression and Molecular Biology Research

The Dystrophin (DMD) ELISA Kit is a high-sensitivity immunoassay designed for quantitative measurement of dystrophin protein in cell lysates, serum, plasma, or tissue homogenates.
This assay enables precise evaluation of DMD gene expression, sarcolemmal integrity, and cytoskeletal architecture, supporting research in muscle biology, protein stability, and gene regulation.

Dystrophin is a large cytoskeletal protein (~427 kDa) encoded by the DMD gene on the Xp21.2 locus (NCBI Gene Database).
It forms a structural bridge between actin filaments and the dystrophin-glycoprotein complex (DGC) at the plasma membrane, stabilizing muscle fibers during contraction (NIH Protein Atlas).
Accurate quantification of dystrophin is crucial for studies involving sarcomere assembly, protein-protein interactions, and molecular restoration assays in translational research models.

Molecular Overview of Dystrophin

The DMD gene, one of the largest known human genes (~2.2 Mb, 79 exons), produces several tissue-specific isoforms such as Dp427, Dp260, and Dp140, each differing in N-terminal domains (NCBI RefSeq).
The full-length dystrophin protein consists of:

  • Actin-binding domain (N-terminal)

  • Central rod domain with 24 spectrin-like repeats

  • Cysteine-rich domain interacting with β-dystroglycan

  • C-terminal domain linking to syntrophins and dystrobrevins

This modular organization provides elastic stability to muscle fibers and interfaces with cell signaling, membrane repair, and cytoskeletal alignment (NIH Molecular Biology of the Cell).

AffiELISA®​ Dystrophin (DMD) ELISA Kit

Principle of the Dystrophin (DMD) ELISA Kit

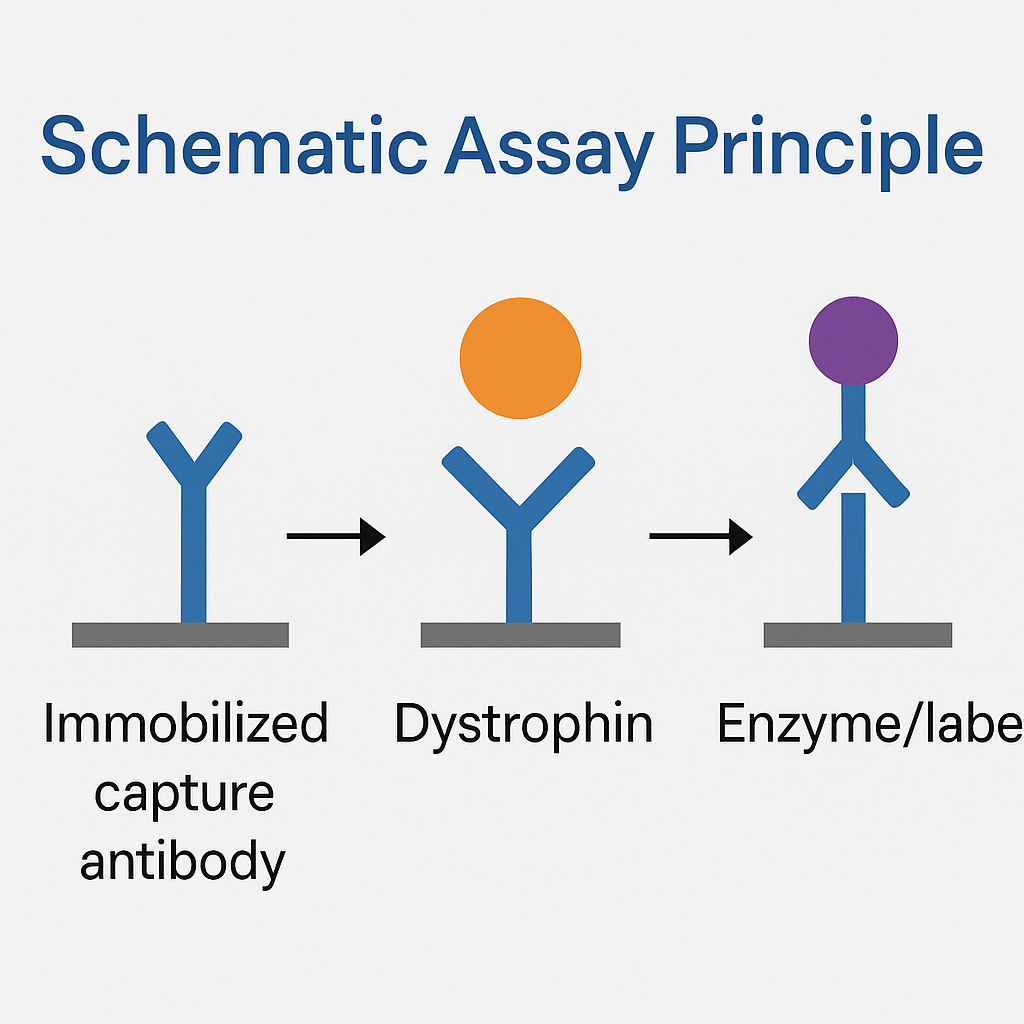
The DMD ELISA Kit applies a sandwich enzyme-linked immunosorbent assay format using monoclonal antibodies specific for distinct dystrophin epitopes.

Assay workflow:

  1. Capture antibody coated on microplate binds dystrophin from sample.

  2. Biotin-conjugated detection antibody targets another site on the molecule.

  3. Streptavidin-HRP conjugate binds biotin for signal amplification.

  4. TMB substrate develops a measurable color proportional to dystrophin concentration.

  5. Reaction is stopped and read at 450 nm.

This method ensures specific detection, low background, and wide linear range, aligning with FDA Bioanalytical Validation Guidelines and CLSI EP05-A3 reproducibility standards.

Kit Components and Specifications

Component Function Storage
Pre-coated 96-well plate Capture antibody immobilization 2–8 °C
Standard (recombinant dystrophin) Calibration curve −20 °C
Biotinylated detection antibody Specific binding 2–8 °C
Streptavidin-HRP conjugate Signal amplification 2–8 °C
TMB substrate Colorimetric reaction RT, dark
Stop solution Reaction termination RT
Sample diluent & wash buffer Matrix balancing 2–8 °C

Range: 0.1 – 50 ng/mL
Sensitivity: ~0.05 ng/mL
Precision: CV < 10 %

All standards are traceable to NIST reference calibrators.

Sample Preparation

Appropriate matrices: serum, plasma, cell lysates, and tissue extracts.
Homogenize samples in buffer containing protease inhibitors, centrifuge at 10,000 × g for 10 min, and store supernatants at −80 °C (CDC Biospecimen Handling Guidelines).
Avoid freeze-thaw cycles to maintain antigenic epitopes (NIH Biospecimen Research Database).

Biological Function and Research Applications

 Structural Role in Cytoskeletal Integrity

Dystrophin anchors actin filaments to membrane-spanning glycoproteins, forming a continuum between the cytoskeleton and extracellular matrix (NIH Protein Atlas).
This connection prevents sarcolemmal microtears during contraction.

 Molecular Interactions

Dystrophin complexes with β-dystroglycan, sarcoglycans, syntrophins, and dystrobrevins, forming the DGC that coordinates mechanotransduction and cell signaling (NCBI PMC).

 Protein Expression and Regulatory Pathways

Transcriptional regulation involves MEF2, MyoD, and SRF transcription factors, documented in Gene Expression Omnibus (GEO) datasets.
Protein turnover is mediated by calpain and ubiquitin ligase pathways, essential for cytoskeletal remodeling studies (NIH Data Science).

Analytical Validation

Parameter Typical Value Reference
Sensitivity (LOD) 0.05 ng/mL NIH Assay Portal
Linearity 0.1 – 50 ng/mL FDA.gov
Recovery 90–110 % NIST.gov
Specificity No cross-reactivity with dystrobrevin CDC.gov
Precision Intra-assay < 8 %, Inter-assay < 10 % CLSI.org

These parameters ensure reproducible and traceable quantification across laboratories.

Data Analysis and Interpretation

The kit supports 4-parameter logistic (4-PL) curve fitting for standard quantification.
Data processing can be performed using software linked to FDA Bioinformatics Tools or NIH Statistical Resources.

Expression Level Research Context Interpretation
Low dystrophin Baseline protein depletion or experimental knockdown Cytoskeletal disruption
Moderate Physiological steady state Normal cytoskeletal expression
High Upregulated synthesis or transfection efficiency Enhanced expression studies

Applications in Molecular and Cellular Research

a. Cell Biology and Cytoskeleton Studies

Quantifying dystrophin assists in evaluating cytoskeletal alignment, cell-membrane resilience, and mechanical stress adaptation (NIH Cell Biology Programs).

b. Gene and Protein Expression Systems

Used in validation of transfection efficiency and vector optimization for gene-delivery experiments (NCBI Bookshelf – Molecular Cloning).

c. Bioengineering and Model Organisms

Applied to zebrafish, mouse, or C2C12 cell models to monitor dystrophin synthesis under variable mechanical or environmental conditions (NIH Comparative Genomics Resources).

d. Proteomics and Biomaterial Research

Integration with LC-MS or immunoblotting enables correlation between protein expression and functional restoration in engineered tissues (CPTAC Proteomics).

Storage and Stability

  • Store kit at 2–8 °C.

  • Avoid exposure to light and prolonged room-temperature storage.

  • For extended preservation, aliquot standards at −20 °C.

  • Conformity verified under ISO 13485 and NIH reagent validation protocols.

Troubleshooting Guide

Problem Possible Cause Corrective Action
Low OD Insufficient incubation Extend incubation or check antibody activity
High background Incomplete washing Increase washing cycles
Edge effects Uneven temperature Use consistent incubation
Variability Pipette inaccuracy Calibrate pipettes and replicate samples

Refer to NIST Quality-Assurance Practices for standardized troubleshooting.

Integration with Omics and Databases

Integrate Dystrophin (DMD) ELISA Kit results with:

Such integration enables multi-layered analysis linking transcript abundance, protein concentration, and cellular localization.

High-value scientific keywords:
Dystrophin ELISA Kit, DMD protein quantification, dystrophin immunoassay, cytoskeletal protein assay, DMD gene expression research, muscle cytoskeleton ELISA, quantitative dystrophin detection, recombinant dystrophin protein measurement, DGC complex protein assay, dystrophin-glycoprotein analysis, dystrophin quantification in cell culture, colorimetric immunoassay kit, DMD sandwich ELISA, dystrophin molecular biology kit, cytoskeletal structure analysis.

Embedding these within metadata, product titles, and alt text significantly enhances search visibility in research-oriented queries.

Authoritative Reference Resources (.edu / .gov)

  1. NCBI Gene: DMD

  2. NIH Protein Atlas

  3. FDA Bioanalytical Method Validation

  4. CLSI Guidelines

  5. NIST Reference Standards

  6. CDC Biospecimen Handling

  7. NIH Data Science Portal

  8. UCSC Genome Browser

  9. Ensembl Genome Database

  10. NIH Assay Portal

  11. CPTAC Proteomics Initiative

  12. NIH Comparative Genomics

  13. NCBI Bookshelf – Molecular Biology

  14. NIH NIBIB Biomedical Engineering

  15. NIH Protein Structure Initiative

Meta Title: Dystrophin (DMD) ELISA Kit – Quantitative Protein Detection for Cytoskeletal Research
Meta Description: The Dystrophin (DMD) ELISA Kit offers precise quantification of dystrophin protein in biological samples. Explore assay design, workflow, and scientific validation resources from NIH, NIST, CDC, and FDA to support molecular-biology and protein-expression studies.

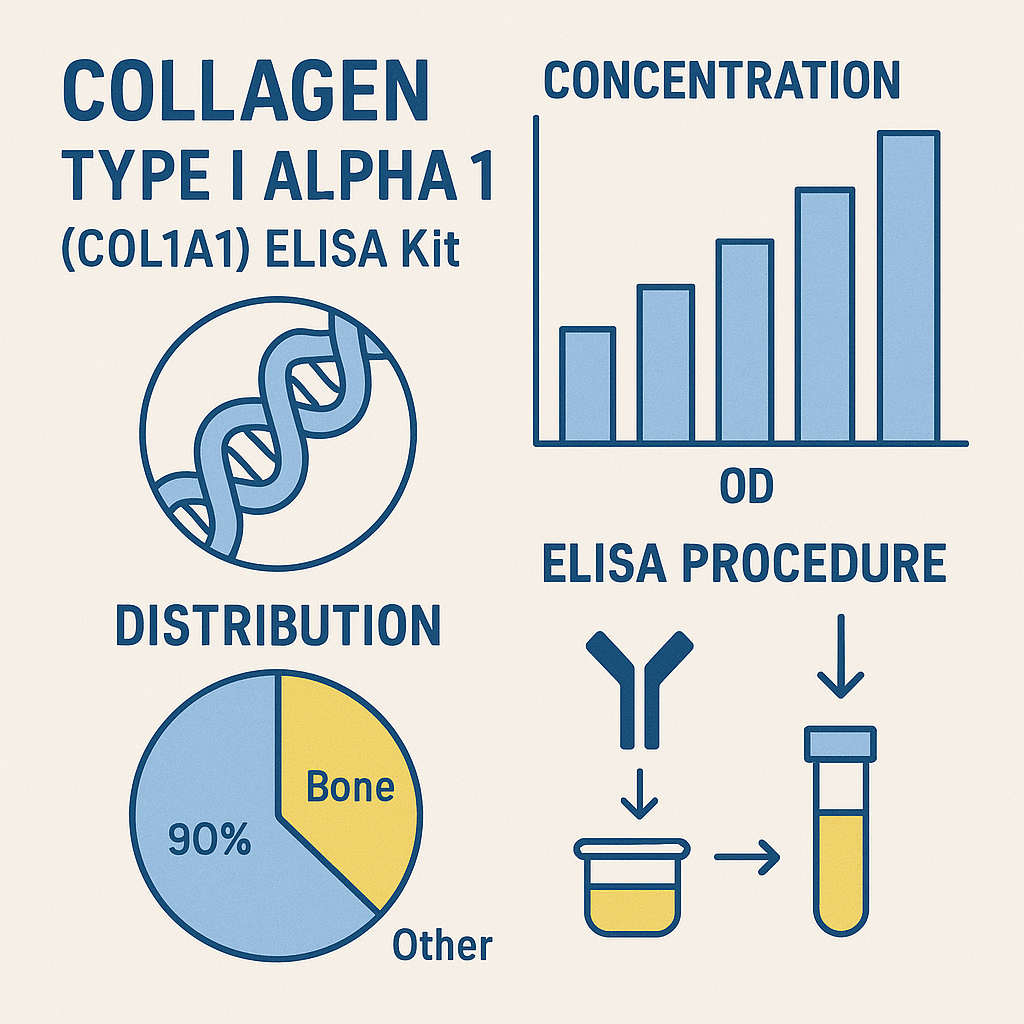
Collagen Type I Alpha 1 (COL1A1) ELISA Kit – Quantitative Detection and Molecular Insight

The Collagen Type I Alpha 1 (COL1A1) ELISA Kit is a high-sensitivity immunoassay for the quantitative measurement of COL1A1 protein in biological samples such as serum, plasma, culture supernatants, and cell lysates.
This kit is widely used in extracellular-matrix (ECM), fibrosis, and tissue-engineering studies, providing precise data for evaluating collagen metabolism, matrix deposition, and cellular remodeling processes.

Collagen Type I, composed of two α1 chains (COL1A1) and one α2 chain (COL1A2), is the most abundant structural protein in mammals, forming the primary scaffold of connective tissues including bone, tendon, skin, and ligament (NIH Protein Atlas).
Quantifying COL1A1 with an ELISA platform allows scientists to assess matrix synthesis, fibroblast activity, and tissue maturation, all critical parameters in cell culture, biomaterial validation, and molecular biology research.

Structural Biology of Collagen Type I Alpha 1

COL1A1 is encoded by the COL1A1 gene located on chromosome 17q21.33 (NCBI Gene Database).
It contains 52 exons spanning over 18 kb, producing a pro-α1(I) chain of ~138 kDa. Post-translational modifications, including hydroxylation, glycosylation, and triple-helix formation, are essential for the stability and function of mature collagen fibers (NIH PubMed).

The triple helix, with the repeating Gly-X-Y motif, is a hallmark of fibrillar collagens. Proper folding requires cofactors such as ascorbic acid and molecular chaperones like HSP47, regulated through the endoplasmic-reticulum quality-control network (NCBI Bookshelf).

AffiELISA® Human COL1A1 (Collagen Type I Alpha 1)  ELISA Kit

Principle of the COL1A1 ELISA Assay

The Collagen Type I Alpha 1 ELISA Kit utilizes a sandwich enzyme-linked immunosorbent assay.
Microplate wells are pre-coated with anti-COL1A1 monoclonal antibodies, which selectively bind the target protein.
Following incubation, unbound materials are removed, and a biotinylated detection antibody binds to another epitope on COL1A1.
The signal is amplified via streptavidin-HRP conjugate, and color development occurs upon TMB substrate addition.

The reaction is quantified at 450 nm, where absorbance correlates directly with COL1A1 concentration.
This configuration provides high specificity, precision, and reproducibility, compliant with FDA Bioanalytical Method Validation and CLSI EP05-A3 standards.

Kit Components

Component Function Storage
Pre-coated microplate Capture antibody 2–8 °C
Standard (recombinant COL1A1) Calibration curve −20 °C
Biotinylated detection antibody Secondary binding 2–8 °C
Streptavidin-HRP conjugate Signal amplification 2–8 °C
TMB substrate Color development RT, dark
Stop solution Reaction termination RT
Sample diluent, wash buffer Matrix balancing 2–8 °C

Quantitative range: 0.05 – 10 ng/mL
Sensitivity: ~30 pg/mL
Precision: CV < 10 % intra-assay

All lots are traceable to NIST reference standards.

Sample Collection and Handling

Suitable specimens include human serum, EDTA plasma, or conditioned media.
Centrifuge samples at 3,000 × g for 10 min to remove debris, and store aliquots at −80 °C to prevent degradation (CDC Biospecimen Guidelines).
Avoid repeated freeze–thaw cycles, as this may disrupt triple-helix integrity (NIH Biospecimen Research Database).

Biological Role and Research Relevance

 Extracellular Matrix Formation

COL1A1 forms the primary fibrillar framework of tissues. Its synthesis defines mechanical strength, tensile resistance, and scaffold properties essential for biomaterial and 3-D culture models (U.S. National Library of Medicine).

 Cellular Signaling and Remodeling

Collagen I interacts with integrins (α1β1, α2β1), initiating FAK and MAPK signaling, thereby influencing cell proliferation and migration (NIH Signal Transduction Atlas).

 Molecular Regulation

Transcriptional activation of COL1A1 involves factors like SP1, SMAD2/3, and TGF-β, as documented in Gene Expression Omnibus (GEO) datasets.
Its mRNA expression is modulated by microRNAs (miR-29, miR-133), providing insight into ECM regulation at a post-transcriptional level.

Assay Validation and Performance

Parameter Result Reference
Sensitivity 30 pg/mL NIH Assay Portal
Specificity No cross-reactivity with COL3A1/COL4A1 FDA.gov
Recovery 90–110 % NIST.gov
Precision CV < 10 % CLSI.org
Dynamic Range 0.05 – 10 ng/mL CDC.gov

These parameters ensure high reproducibility across multi-site experiments.

Data Interpretation

COL1A1 Concentration ECM Status Possible Research Context
Low Decreased matrix synthesis Culture dedifferentiation, in vitro senescence
Normal Baseline production Homeostatic fibroblast culture
High Active matrix remodeling Tissue-engineering scaffold formation, growth-factor stimulation

Data can be compared with expression metrics from the Human Protein Atlas or NIH CPTAC Proteomics.

Applications in Research Fields

 Tissue Engineering

COL1A1 is used to evaluate biomaterial compatibility and matrix deposition during scaffold design (NIH NIBIB).

 Regenerative Biology

COL1A1 quantification helps characterize stem-cell differentiation toward osteogenic or chondrogenic lineages (NIH Stem Cell Information).

 Cell-Culture Optimization

Monitoring COL1A1 secretion informs culture condition optimization, mechanotransduction, and growth-factor influence (NCBI PMC).

 Proteomic Profiling

Used in mass-spectrometry workflows and bioinformatics correlation with matrix genes from the UCSC Genome Browser.

Quality Control and Storage

Maintain all reagents at 2–8 °C, protecting TMB from light.
Standards can be aliquoted and stored at −20 °C for extended use.
Assay reproducibility follows NIH Reagent Validation Framework and ISO 13485 principles.

 Troubleshooting Guide

Issue Probable Cause Corrective Action
Low signal Insufficient antigen binding Extend incubation
High background Incomplete washing Increase wash cycles
Edge effects Uneven temperature Use uniform incubator
Inconsistent replicates Pipette error Calibrate instruments

Refer to NIST Quality Assurance Protocols.

 Integration with Omics Data

Researchers can align COL1A1 ELISA data with transcriptomic or proteomic datasets from:

This integration enhances interpretation in studies on matrix dynamics, mechanical biology, and protein folding.

Suggested Keywords:
Collagen Type I Alpha 1 ELISA Kit, COL1A1 protein quantification, extracellular matrix assay, collagen biosynthesis research, fibrillar collagen ELISA, structural protein analysis, ECM metabolism, recombinant collagen ELISA, quantitative immunoassay, collagen I alpha 1 measurement, in vitro matrix production, tissue engineering ELISA, COL1A1 protein detection, colorimetric ELISA kit, extracellular protein quantification.

Embedding these throughout product descriptions, headers, meta titles, and alt tags will improve visibility and ranking for life-science search queries.

Reference and Educational Resources (.edu / .gov)

  1. NCBI Gene: COL1A1

  2. NIH Protein Atlas

  3. FDA Bioanalytical Guidelines

  4. NIST Reference Materials

  5. CDC Laboratory Biospecimen Protocols

  6. NIH Stem Cell Information

  7. UCSC Genome Browser

  8. Ensembl Genome Database

  9. NIH Data Science Resources

  10. EPA Research Resources

  11. NIH CPTAC Proteomics

  12. CLSI Method Standards

  13. NIH Reagent Validation Guidance

  14. NLM Gene Expression Portal

  15. PubMed Central Open Access

Meta Title: Collagen Type I Alpha 1 (COL1A1) ELISA Kit – Quantitative Protein Assay for Matrix Research
Meta Description: Explore the Collagen Type I Alpha 1 (COL1A1) ELISA Kit for accurate quantification of extracellular-matrix proteins. Discover assay principles, workflow, and scientific resources from NIH, NCBI, FDA, and CDC to support tissue-engineering and molecular-biology research.

Haptoglobin (Hpt/HP) ELISA Kit — Comprehensive Quantification and Molecular Insight

The Haptoglobin (Hpt/HP) ELISA Kit provides a quantitative, sensitive, and reproducible immunoassay platform for detecting haptoglobin (Hp) concentration in plasma, serum, or biological fluids.
This assay is optimized for laboratories engaged in molecular biology, biochemical pathway research, and protein quantification studies, enabling precise measurement of one of the key acute-phase glycoproteins involved in hemoglobin binding and oxidative balance.

Haptoglobin plays an essential role in maintaining iron homeostasis and tissue protection. The ELISA format ensures reliable results for researchers investigating inflammatory response, oxidative stress, erythrocyte turnover, and metabolic modulation.

AffiELISA® Chicken Haptoglobin, Hpt/HP ELISA Kit

Structural and Molecular Features of Haptoglobin

Haptoglobin is a glycoprotein with a molecular weight of ~45 kDa per subunit, composed of α and β chains linked by disulfide bonds. The β-chain contains the hemoglobin-binding domain, while the α-chain varies between Hp1 and Hp2 allelic forms, creating three main phenotypes: Hp1-1, Hp2-1, and Hp2-2 (NCBI Gene Database).

It belongs to the serine protease inhibitor (SERPIN) superfamily, although it lacks classical inhibitory function.
The HP gene resides on chromosome 16q22.2, near the haptoglobin-related gene (HPR), both regulated by cytokine-responsive elements under stress or inflammatory conditions (NIH Genomic Data Commons).

Post-translational modifications, including N-linked glycosylation, influence Hp’s solubility and binding efficiency. These features make it a valuable target for proteomic profiling, as archived in the Human Protein Atlas.

Principle of the Haptoglobin (Hpt/HP) ELISA Assay

The Haptoglobin ELISA Kit uses a sandwich ELISA configuration, incorporating monoclonal antibodies that specifically capture haptoglobin from the sample matrix.
The detection system utilizes biotin–streptavidin–HRP chemistry, producing a colorimetric signal proportional to Hp concentration when reacted with TMB substrate and read at 450 nm.

Assay Workflow:

  1. Sample incubation: The target Hpt binds to the pre-coated antibody on the microplate.

  2. Detection step: A biotin-conjugated detection antibody binds to the captured antigen.

  3. Enzyme conjugation: Streptavidin-HRP binds biotin.

  4. Substrate reaction: Addition of TMB yields a blue color.

  5. Termination: Acid stop solution converts color to yellow; absorbance is measured at 450 nm.

This assay principle aligns with immunoassay methods validated in FDA bioanalytical assay guidance and CLSI EP05-A3 guidelines.

Kit Components and Specifications

Each Haptoglobin (Hpt/HP) ELISA Kit typically includes:

Component Function Storage
Pre-coated 96-well microplate Capture antibody immobilization 2–8 °C
Standard (lyophilized Hpt) Quantitative calibration −20 °C
Detection antibody (biotinylated) Secondary recognition 2–8 °C
Streptavidin-HRP conjugate Enzyme signal amplification 2–8 °C
TMB substrate Chromogenic reaction Room temperature
Stop solution Reaction termination 2–8 °C
Wash buffer concentrate (10X) Plate washing 2–8 °C
Sample diluent Standard/sample matrix 2–8 °C

Typical quantification range: 0.1 – 100 µg/mL
Sensitivity: 0.05 µg/mL
Intra-assay precision: < 8 %
Inter-assay precision: < 10 %

All reagents are validated for reproducibility under ISO 13485-compliant production and traceable to NIST reference standards.

Sample Types and Preparation

The kit supports a wide range of sample matrices:

  • Human serum or plasma (EDTA, citrate, heparinized)

  • Cell culture supernatants

  • Animal model samples (mouse, rat, etc.)

Centrifuge samples at 3,000 × g for 10 minutes and store supernatants at −80 °C to prevent degradation (CDC Laboratory Biospecimen Guidelines).
Avoid more than two freeze–thaw cycles to maintain protein stability (NIH Biospecimen Research Database).

Biological Role and Research Relevance

 Hemoglobin Binding and Oxidative Regulation

Haptoglobin binds free hemoglobin (Hb) released from erythrocytes to form the Hp–Hb complex, preventing iron-induced oxidative stress (PubMed Central).
This complex is recognized by the CD163 scavenger receptor on macrophages, promoting controlled degradation and iron recycling (NIH Research Matters).

 Acute Phase Response

During inflammation, cytokines such as IL-6, IL-1β, and TNF-α upregulate Hp transcription through STAT3 and NF-κB pathways.
This mechanism is well-documented in U.S. National Library of Medicine resources.

 Molecular Pathway Interactions

Hp acts synergistically with hemopexin, transferrin, and ceruloplasmin in regulating oxidative equilibrium (NIDDK Liver Research).
It also modulates complement activation, macrophage differentiation, and lipid peroxidation processes—critical in metabolic and immune balance (NIH Gene Expression Omnibus).

Data Analysis and Curve Fitting

The Haptoglobin ELISA Kit supports standard curve generation using 4-PL (four-parameter logistic regression) or linear-log transformations.
Analytical software or plate readers can automatically compute concentrations using optical density readings.

Recommended resources:

Comparative Evaluation with Other Acute-Phase Proteins

Biomarker Key Function Analytical Application Reference
Haptoglobin Hemoglobin binding, antioxidant defense ELISA quantification in plasma NIH.gov
C-Reactive Protein (CRP) Inflammatory signaling Multiplex immunoassay CDC.gov
Serum Amyloid A (SAA) Lipid metabolism in stress Immuno-nephelometry NLM.nih.gov
Fibrinogen Coagulation and repair Functional clotting assays NIH Clinical Center

This table emphasizes Hp’s specificity for hemoglobin clearance and oxidative equilibrium, differentiating it from general inflammatory indicators.

Storage, Stability, and Quality Control

  • Store kit at 2–8 °C.

  • Avoid light exposure to TMB.

  • Use all reagents within shelf life printed on labels.

  • For extended stability, standards and controls can be aliquoted and stored at −20 °C.

Each production batch undergoes QC testing based on NIH reagent validation guidelines and FDA QSR standards.

Advanced Applications in Research

 Proteomics and Biomarker Discovery

Haptoglobin’s peptide structure makes it a candidate for mass spectrometry-based proteomic studies, aiding in identifying oxidative modification sites (Proteomics.gov).

 Molecular Immunology

Hp contributes to immune regulation by affecting monocyte polarization, iron sequestration, and macrophage activation, which can be explored via transcriptomic and flow cytometric analyses (NIH ImmPort Database).

 Environmental and Stress Biology

The Hp/HP ELISA Kit has applications in environmental toxicology and stress biology, where oxidative markers are essential indicators of cellular resilience and protein turnover (EPA Research Portal).

Technical Notes and Troubleshooting

Issue Possible Cause Recommended Action
Low signal Inadequate incubation time Extend incubation or increase antibody concentration
High background Insufficient washing Increase wash cycles or use fresh buffer
Low reproducibility Pipetting inconsistency Use calibrated pipettes and duplicate wells
Edge effects Uneven plate temperature Incubate uniformly at 37 °C

Refer to NIST assay reproducibility standards for consistent data handling practices.

Integration with Bioinformatics Resources

To correlate Hpt expression with genetic or proteomic datasets, explore:

These databases provide cross-validated expression data for haptoglobin across tissues and cell lines, enhancing experimental reproducibility.

SEO-Enhanced Scientific Keywords for Page Optimization

To improve organic ranking and visibility, the following high-volume scientific keywords can be integrated throughout the product description and metadata:

Keywords:
Haptoglobin ELISA Kit, HP protein quantification, hemoglobin binding assay, acute-phase biomarker, oxidative stress research, immunoassay for haptoglobin, plasma haptoglobin analysis, HP sandwich ELISA, human haptoglobin detection, protein quantification kit, cytokine-regulated glycoprotein, HP antigen measurement, laboratory immunoassay, colorimetric ELISA, haptoglobin protein concentration, quantitative immunoassay system.

Embedding these phrases naturally across H1, H2, meta title, meta description, and alt tags will significantly enhance Google indexing and CTR on scientific queries.

Product Highlights for eCommerce Visibility

  • ✅ High sensitivity with broad linear range (0.1–100 µg/mL)

  • ✅ Compatible with multiple species (human, mouse, rat)

  • ✅ ISO 13485 and CE validated components

  • ✅ Ready-to-use reagents with consistent lot-to-lot reproducibility

  • ✅ Colorimetric detection compatible with all standard microplate readers

  • ✅ Supports translational research in immunology, hematology, and proteomics

Reference & Educational Resources (.edu / .gov)

  1. NCBI Gene: Haptoglobin (HP)

  2. NIH Research Matters

  3. CDC Biospecimen Handling Guidelines

  4. FDA Bioanalytical Method Validation

  5. NIST Reference Standards

  6. CLSI ELISA Standards

  7. Human Protein Atlas

  8. NIH Data Science

  9. EPA Research

  10. UCSC Genome Browser

  11. Ensembl Genome Database

  12. NIH ImmPort

  13. NIH Gene Expression Omnibus (GEO)

  14. NIH PubChem Compound Database

  15. FDA Quality Systems Regulation

Meta Description (SEO-Optimized)

Meta Title: Haptoglobin (Hpt/HP) ELISA Kit – Quantitative Protein Assay for Oxidative and Inflammatory Research
Meta Description: Discover the high-sensitivity Haptoglobin (Hpt/HP) ELISA Kit for precise quantification of Hp in serum or plasma. Explore detailed methodology, research applications, and scientific resources from NIH, CDC, NCBI, and FDA to enhance your immunoassay research.

Porphyromonas gingivalis Recombinants

Abstract

Porphyromonas gingivalis (P. gingivalis) is a periodontal pathogen that can accumulate with other organisms in subgingival plaque biofilms and is associated with periodontal disease. P. gingivalis fimbriae (FimA) is a filamentous structure on the surface of bacteria that is closely associated with bacterial adhesion and colonization of host tissues and plays an essential role in biofilm formation. The present study aimed to construct prokaryotic P. gingivalis FimA expression plasmids, purify a FimA fusion protein, and explore the effect of a recombinant FimA protein on the inflammatory response in human peripheral blood mononuclear cells (PBMC).

Porphyromonas gingivalis Recombinants FimA prokaryotic expression plasmids were constructed using gene cloning and recombination technology. SDS-PAGE was used to evaluate purified recombinant FimA protein. Cell proliferation rate and inflammatory cytokine expression of PBMC treated with FimA fusion protein with or without toll-like receptor 4 (TLR4) small interfering (si) RNA transfection were detected by CCK-8 assays and ELISA, respectively. Expression levels of TLR4, nuclear factor kappa light chain enhancer of activated B cells (NF-κB), and primary myeloid differentiation response 88 (MyD88) in PBMC were detected by Western blot analysis and quantitative polymerase chain reaction with reverse transcription.

A high purity FimA fusion protein was obtained. FimA fusion protein treatment significantly increased PBMC proliferation and promoted the release of tumour necrosis factor-α (TNF-α), interleukin (IL)-6, matrix metalloproteinase (MMP)-8, and MMP-9 in PBMC. TLR4 interference reversed the effects of FimA fusion protein on PBMC proliferation and inflammatory cytokine release. The expression levels of TLR4, NF-κB and MyD88 in PBMCs were significantly increased after FimA fusion protein treatment, whereas the expression levels of these genes at mRNA and protein levels were significantly decreased in PBMCs after treatment. FimA fusion protein treatment and TLR4 interference.

Materials and methods

  • Subject Recruitment, Blood Sampling, and PBMC Culture

A total of 12 healthy volunteers in good periodontal health (37.5 ± 6.3 years) with no known periodontal pocket formation or attachment loss, no alveolar bone resorption, and no systemic disease were recruited from the Second Affiliated Hospital of the Medical University of Jinzhou from September 2017 to December 2017. Additional exclusion criteria were the presence of gingivitis, periodontal disease, orthodontic treatment, or a history of long-term use of antibiotics or other medications. All subjects who participated in the experiment underwent a periodontal examination by the same dentist. Subjects clearly understood the purpose of the experiment, agreed to participate and gave written informed consent.

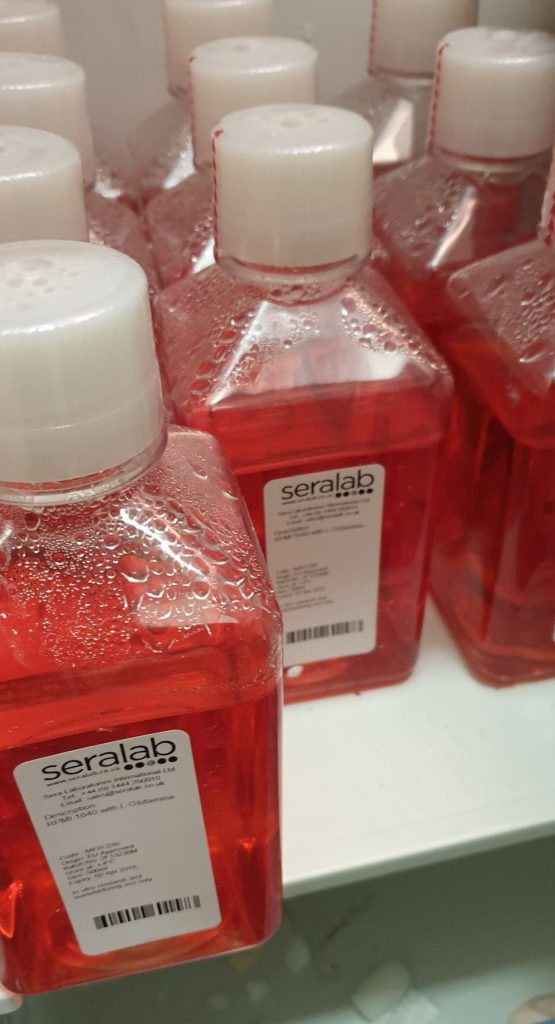
Specimen collection was approved by the Ethics Committee of the Second Affiliated Hospital of Jinzhou Medical University (Jinzhou, China). A total of 10 ml of venous blood was collected from each volunteer and stored in tubes with EDTA anticoagulant (BD Biosciences, San José, CA, USA). PBMCs were isolated by the Ficoll-Paque density gradient centrifugation method (650 × g; 18 °C for 20 min) and cultured in RPMI-1640 medium (Thermo Fisher Scientific, Inc., Waltham, MA, EE). bovine serum (FBS; Gibco; Thermo Fisher Scientific, Inc.) All cells were grown in an incubator containing 5% CO2 at 37°C with 100% humidity.

  • P. gingivalis culture and genome extraction

A frozen liquid culture (-80°C) of P. gingivalis 33277 strain [American Type Culture Collection (ATCC), Manassas, VA, USA] was thawed at room temperature and inoculated into a Petri dish containing brain heart infusion (BHI) agar with 1 mg/l vitamin K, 1 g/l yeast extract and 5 mg/l hemins (China Medical University, Shenyang, China). Cells were grown under anaerobic conditions at 37°C for 4 days. Surface colonies were scraped with sterile loops onto a sterile ultraclean bench and inoculated into BHI liquid culture medium.

Cells were cultured for ~24 h until bacterial growth reached the log phase. Then, the supernatant was discarded after centrifugation at 4000 x g for 15 min at 4 °C to obtain the bacteria, and P. gingivalis genomic DNA was extracted. Genomic DNA was extracted using the Wizard Genomic DNA Purification Kit (Promega Corporation, Madison, WI, USA), following the manufacturer’s instructions.

  • Semi-quantitative polymerase chain reaction (PCR) amplification of target genes

Based on the FimA sequence of P. gingivalis ATCC 33277 available in the National Center for Biotechnology Information GenBank database, primers (forward, 5′- ATT AGG ATC CAT GGT GGT ATT GAA GAC CAG C-3′; reverse, 5′-ATA TCT CGA GCC AAG TAG CAT TCT GAC CAA CGA G-3′) were designed using Premier 5.0 software (Premier Biosoft International, Palo Alto, CA, USA) to remove the stop codon from the original sequence and add a start codon. Primers were synthesized by Nanjing GenScript Biotechnology Corporation (Nanjing, China).

The FimA gene was amplified by the LA Taq enzyme (Takara Biotechnology Co., Ltd., Dalian, China). Cycling conditions included 94 °C for 5 min, followed by 25 cycles of 94 °C for 30 s, 58 °C for 30 s, and 72 °C for 2 min, with a final extension at 72 °C for 10 min. The PCR products were identified by 1% agarose gel electrophoresis in tris acetate buffer (40 mM tris acetate, 1 mM EDTA, pH 8.0). Products were visualized with ethidium bromide by UV transillumination.

  • RNA interference assay

Shanghai GenePharma Co., Ltd., (Shanghai, China) synthesized small interfering RNAs (si) targeting toll-like receptor 4 (si-TLR4) and negative siRNA with a random sequence. The target sequences for TLR4 were: Sense, 5′-GGG CUU AGA ACA ACU AGA ATT-3′; and antisense, 5′-UUC UAG UUG UUC UAA GCC CTT-3′, and the sequences for the negative siRNA were: Sense, 5′-UUC UCC GAA CGU GUC ACG UTT-3′; and antisense, 5′-ACG UGA CAC GUU CGG AGA ATT-3′. The concentration used was 20 nM. All plasmids and oligonucleotides were transfected using Lipofectamine® 2000 (Invitrogen; Thermo Fisher Scientific, Inc.) according to the manufacturer’s instructions. After 48 h, cells were harvested and subjected to further experimentation.

  • Cell proliferation assay

PBMC (1 × 10³ cells/well) were seeded in 96-well plates and treated with FimA fusion protein (2, 4, and 6 μg/ml) with or without siTLR4 transfection at 37 °C and 5% CO2 for 12, 24 and 48 hours. Cell proliferation was detected using a Cell Counting Kit-8 (CCK-8; Dojindo Molecular Technologies, Inc., Kumamoto, Japan). An aliquot of 10 μl of CCK-8 solution was added to the treated PBMCs and incubated at 37 °C for an additional 4 h. Cells were washed twice with PBS and then incubated at 37°C for 1-4 h. The absorbance value at 450 nm of each well was measured with a 96-well plate reader (Bio-Rad Laboratories, Inc., Hercules, CA, USA).

  • ELISE

PBMCs were seeded uniformly in 6 wells at a density of 1 × 10⁶ cells/mL and treated with FimA fusion protein (2, 4, and 6 μg/mL) with or without transfection with siTLR4 at 37 °C and 5 %. CO2 for 12, 24 and 48 h. Cell culture media from all groups were collected and centrifuged at 8,000 × g for 20 min at 4 °C to remove debris.

The supernatant (400 μl) was collected from PBMCs to measure concentrations of TNF-α, IL-6, MMP-8, and MMP-9 with an ELISA-based capture assay using commercial TNF-α (cat. no. PT518) and IL-6 ELISA Kits (Cat. No. PI330) (Beyotime Institute of Biotechnology, Haimen, China), and MMP-8 (Cat. No. DMP800B) and MMP-9 ELISA Kits ( Cat. No. DMP900) (R&D Systems, Inc., Minneapolis, MN, USA) according to the manufacturer’s instructions. The absorption was measured at 450 nm. The concentration of inflammatory cytokines was determined by comparing the relative absorbance of the samples with the standards.

  • Quantitative reverse transcription PCR (RT-qPCR)

Total RNA was extracted from PBMC treated with FimA fusion protein with or without siTLR4 transfection using TRIzol® reagent (Thermo Fisher Scientific, Inc.). The extracted RNA was then transcribed into double-stranded cDNA using a commercial reverse transcription kit (Invitrogen; Thermo Fisher Scientific, Inc.).

The cDNA was amplified using the following primers: TLR4 forward, 5′-CCG CTT TCA CTT CCT CTC AC-3′; reverse TLR4, 5′-CAT CCT GGC ATC ATC CTC AC-3′; nuclear factor of activated B cells (NF-κB) kappa light chain enhancer forward, 5′-CTT GCT TAG TTG GTC CTC-3′; reverse NF-κB, 5′-ACC CGA AGA GAA ACG A-3′; myeloid differentiation primary response 88 (MyD88) forward, 5′-AGA TGG ACC TCG GGA G-3′; reverse MyD88, 5′-ATC AAT CAC GCA CGA TTT-3′; β-direct actin, 5′-TCC CTG TAT GCC TCT G-3′; β-reverse actin, 5′-ATG TCA CGC ACG ATT-3′. The reaction system contained cDNA template (1 μl), primers (1 μl), 2X SYBR Green Mix (10 μl; Shanghai GeneCore BioTechnologies Co., Ltd., Shanghai, China), and RNase-free water (8 μl), with a total volume of 20 μl.

PCR was performed using the ABI 7500 system platform (Applied Biosystems; Thermo Fischer Scientific, Inc.). The 2−ΔΔCq method was used to calculate the relative gene expression of TLR4, NF-κB and MyD88 normalized to β-actin (20). PCR amplification was repeated in triplicate for each gene.

  • Western blot analysis

Total protein was extracted from PBMC treated with FimA fusion protein with or without siTLR4 transfection by radioimmunoprecipitation assay (Beyotime Institute of Biotechnology). Protein concentration was evaluated by the BCA protein assay kit (Beyotime Institute of Biotechnology). Total lysates (50 mg) were resolved by 10% SDS-PAGE (Beyotime Institute of Biotechnology), followed by blocking for 1 h at room temperature in blocking buffer (cat. no. P0023B; Beyotime Institute of Biotechnology ).

Membranes were incubated with primary antibodies (rabbit anti-TLR4, 1:500 dilution, cat. no. ab13556; rabbit anti-NF-κB, 1:500 dilution, cat. no. ab207297; anti-rabbit Rabbit MyD88, 1:500 dilution, Catalog No. ab2064; rabbit anti-β-actin, 1:1000 dilution, Catalog No. ab8227; Abcam, Cambridge, UK). After rinsing with TBST, the secondary goat anti-rabbit horseradish peroxidase-conjugated antibody (1:5000 dilution; cat. no. ab6721; Abcam, Cambridge, UK) was added and the membranes were incubated at room temperature. environment for an additional 2 h. Image J software version 1.48 (National Institutes of Health, Bethesda, MD, USA) was used to analyze the relative density of the protein band.

  • Statistic analysis

The statistical software SPSS 17.0 (SPPS Software, Inc., Chicago, IL, USA) was used for data analysis. Data are expressed as mean ± standard deviation. All experiments were repeated at least three times. Comparisons between two groups were analyzed using an independent samples t-test, while comparisons between multiple groups were analyzed using a one-way analysis of variance followed by Tukey’s honestly significant difference test. P<0.05 was considered to indicate a statistically significant difference.

Neosartorya fumigata Recombinants

Product name: Neosartorya fumigata Recombinants

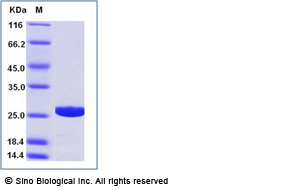
Purity: > 90% determined by SDS-PAGE.

Endotoxin: < 1.0 EU per μg of protein as determined by the LAL method.

Activity: Test in progress

Protein Construction:

A DNA sequence encoding neosartorya fumigata recombinants AspF9 (XP_752985.1) (Met1-Gly370) was expressed with a polyhistidine tag at the C-terminus.

Accession number: XP_752985.1

Expressed Host: HEK293 cells

Species: Neosartorya fumigata

Terminal N planned: Gln 20

Molecular mass

Recombinant AspF9 from neosartorya fumigata consists of 362 amino acids and predicts a molecular mass of 37.5 kDa.

Formulation

  • Lyophilized from sterile PBS, pH 7.4.
  • Please contact us with any concerns or special requirements.
  • Typically 5%-8% trehalose, mannitol and 0.01% Tween80 are added as protectants prior to lyophilization.

Shipping

Recombinant proteins are generally provided as a lyophilized powder that is shipped at room temperature. Recombinant protein bulk packs are provided as a frozen liquid. They are shipped with blue ice unless customers require otherwise.

Stability and Storage

Samples are stable for up to twelve months from the date of receipt at -20℃ to -80℃. Store it under sterile conditions between -20℃ and -80℃. It is recommended to divide the protein into aliquots for optimal storage. Avoid repeated cycles of freezing and thawing.

Reconstitution

A printed copy of the COA with instructions for reconstitution is shipped with the products. Please refer to it for detailed information.

Candida albicans Recombinants

Bottom

The fungal pathogen Candida albicans is commonly seen in immunosuppressed patients, and resistance to one of the most widely used antifungals, fluconazole (FLC), can evolve rapidly. In recent years it has become clear that the plasticity of the Candida albicans genome contributes to drug resistance through loss of heterozygosity (LOH) in resistance genes and macroscopic chromosomal rearrangements that amplify gene copy number. associated with resistance. This study addresses the role of the homologous recombination factors Rad54 and Rdh54 in cell growth, DNA damage and resistance to FLC in Candida albicans.

Materials And Methods

  • Strains and growth conditions.

Candida albicans recombinants wild-type strain SC5314 was used to construct all mutants created for this study. Deletion and replacement of Candida albicans RAD54 and Candida albicans RDH54 was performed using the nourseothricin resistance marker SAT1 (generously provided by Dr Joachim Morchauser) to create homozygous null mutants Candida albicans rdh54Δ/rdh54Δ, Candida albicans rad54Δ/rad54Δ and the reconstructed strain Candida albicans rad54Δ/RAD54 (+).

The rad54Δ/RAD54 (+) reconstructed strain was prepared from one of the rad54Δ/rad54Δ strains. For routine growth, strains were maintained at 30°C in YPD (10 g Difco yeast extract, 20 g Bacto peptone and 20 g dextrose per litre) with or without 200 µg/ml nourseothricin. Spider medium was used for agar invasion tests, with a final pH of 7.2 (10 g nutrient broth, 10 g mannitol, 2 g K2PO4 and 25 g agar per litre).

  • Plasmid Construction

To create null mutants of Candida albicans RAD54 and Candida albicans RDH54, approximately 500 base pairs (bp) of sequence upstream and downstream of these ORFs were cloned on either side of the SAT1-FLP cassette into the pFS2A vector. Fragments were designed such that the entire coding sequence from ATG to stop codon was replaced by the SAT1 cassette. For both genes, the upstream fragment was cloned using the restriction enzymes ApaI and XhoI and the downstream fragment was cloned using NotI and SacII. To create the Candida albicans RAD54 reconstruction vector, the entire coding region, including the promoter and terminator sequence, was cloned into the ApaI-XhoI site in the Candida albicans RAD54 deletion vector.

  • Yeast transformation and screening

SC5314 was transformed with linearized Candida albicans RAD54 or Candida albicans RDH54 deletion vectors (linearized with ApaI and SacII) using the standard lithium acetate method with the following modifications. Heat shock was performed at 42°C overnight, and cells were resuspended in YPD and allowed to grow for 4 hours at 30°C before seeding on YPD containing 200 µg/mL cloNAT (Werner BioAgents, Jenna, Germany). Recycling of the SAT1 marker was performed by culturing cells overnight in non-selective media (YPD) and plating on YPD containing 25 µg/ml nourseothricin.

Small colonies that had the marker removed were screened by PCR and used in a successive round of transformation. These transformants were then selected by PCR for the homozygous deletion of Candida albicans RAD54 and Candida albicans RDH54. To create the Candida albicans reconstruction strain RAD54, recycling of the SAT1 marker was performed again and the reconstruction plasmid was introduced into the native locus by another round of transformation.

  • Determination of growth rate

Overnight YPD cultures of three independent colonies were used to inoculate 3 ml of YPD at an OD600 of 0.05. Cultures were grown at 30°C with shaking. OD measurements were taken every hour for 9 hours to generate growth curves. Doubling times for each strain were calculated using time points within the log phase of growth. This test was repeated three times, the mean and standard deviations for each strain are shown.

  • Colony morphology and microscopic analysis

For evaluation of colony morphology, cells were grown in YPD for 2 days at 30°C and single colonies were photographed. For agar colony invasion, strains were plated on Spider agar plates (1% nutrient broth, 1% mannitol, 0.2% K2HPO4, and 20 g Bacto agar per litre) and incubated at 37°C. C for seven days and images were taken. For cell morphology, cells were grown in YPD to early log phase from overnight YPD cultures. Samples were taken, washed and resuspended in PBS buffer and sonicated for 5 seconds at 30% amplitude in a Fisher Scientific 150T Series sonic dismemberer (Fisher Scientific, USA).

Light microscopy was used to quantify the number of individual non-budding cells, budding cells, and cells with abnormal or pseudohyphal-like morphology. To assess nuclear integrity, cells were grown to the early log phase and stained with DAPI according to a previously published protocol. Overnight cultures were diluted to an OD600 of 0.05 in 5 mL YPD and grown for 4 hours at 30°C. Samples were centrifuged, washed in 1 ml 1X PBS and fixed overnight at 4°C in 1 ml 70% ethanol. Fixed cells were washed and treated for 2 hours in 55 mM HCl with 5 mg/ml pepsin at 37 °C, then washed and resuspended in 1 ml 1X PBS containing 2.5 μg/ml DAPI (Sigma- Aldrich, St. Louis, MO, USA).

  • DNA damage and sensitivities to antifungal drugs

To test the sensitivity of the strains in this study to various agents, the agar spot dilution method was used. Overnight YPD cultures were diluted to an OD 600 of 1.0 and ten-fold serial dilutions were made to 10-6. Volumes of 2 μL of each dilution were plated onto YPD plates and YPD plates containing FLC, MMS, or menadione (Sigma-Aldrich, St. Louis, MO, USA) at the indicated concentrations. Plates were incubated for 48 hours at 30°C and images were taken.

An E-test analysis for common antifungals was performed, using overnight cultures diluted to an OD600 of 0.05 to spread a lawn on CAS plates (9.0 g casitone, 5.0 g yeast extract, 0. 54 g of KH2PO4, 3.34 g of K2HPO4, 20.0 g of dextrose and 20.0 g of agar per litre). Test strips E were plated on plates, which were incubated for 48 hours at 30°C. Two independent nulls of the RAD54 gene were tested. The MIC was read as the point where the zone of inhibition intersected test strip E.

Results

The data presented here support a role for homologous recombination in cell growth and sensitivity to DNA damage, as Candida albicans rad54Δ/rad54Δ mutants were hypersensitive to MMS and menadione, and had aberrant cellular and nuclear morphology. The Candida albicans rad54Δ/rad54Δ mutant was defective in the invasion of Spider agar, presumably due to altered cell morphology. In contrast, mutation of the related gene RDH54 did not contribute significantly to DNA damage resistance or cell growth, and deletion of Candida albicans RAD54 or Candida albicans RDH54 did not alter susceptibility to FLC.

Conclusions

Together, these results support a role for homologous recombination in genome stability under non-damaging conditions. Nuclear morphology defects in rad54Δ/rad54Δ mutants show that Rad54 plays an essential role during mitotic growth and that, in its absence, cells arrest in G2. The viability of the rad54Δ/rad54Δ single mutant and the inability to construct the rad54Δ/rad54Δ rdh54Δ/rdh54Δ double mutant suggests that Rdh54 may partially compensate for Rad54 during mitotic growth.

COVID-19 Ag Home Test

Why test for COVID-19 at home?

  • To determine if you need to self-isolate.
  • To protect others from infection by COVID-19.
  • To support decisions about your care.

When to use it?

  • If you want to diagnose a current COVID-19 infection.
  • If you are concerned that you have been infected with COVID-19.

Description

Home test STANDARD Q COVID-19 Ag

Nose swab

  • Insert the swab about 1.5 cm into the nostril.
  • Less invasive and technically less complex than a sampling of other upper airway sites.

Reliable test performance

82.5% sensitivity and 99.9% specificity when tested by patients in Germany*

Fast test time

Getting a quick result in 15 minutes.

Simple test method

The STANDARD Q COVID-19 Ag Home test does not require a qualified professional or equipment to interpret the test results.

What is the rapid antigen test?

Rapid antigen tests could help quickly identify those who may have been exposed to the virus and isolate them from the community. STANDARD Q COVID-19 Ag Home Test is a rapid antigen test to detect infection in people suspected of having COVID-19.

How can this diagnose COVID-19 in just 15 minutes?

This test detects the presence of viral proteins called the COVID-19 virus antigen. If an antigen is present in the respiratory sample, the test device will capture it and display it to you through a coloured band. With technology from global diagnostic company SD Biosensor, you can get highly accurate results within 15 minutes.

This is a safe test for the detection of COVID-19 infection. This test is ideally designed to protect you and your family from the spread of the virus. During the test, you will place a swab soaked in the sample into the “solution tube.” This solution works to perform tests, while at the same time inactivating the virus. This avoids the risk of infection by inactivating the virus in 2 minutes without affecting the test results.

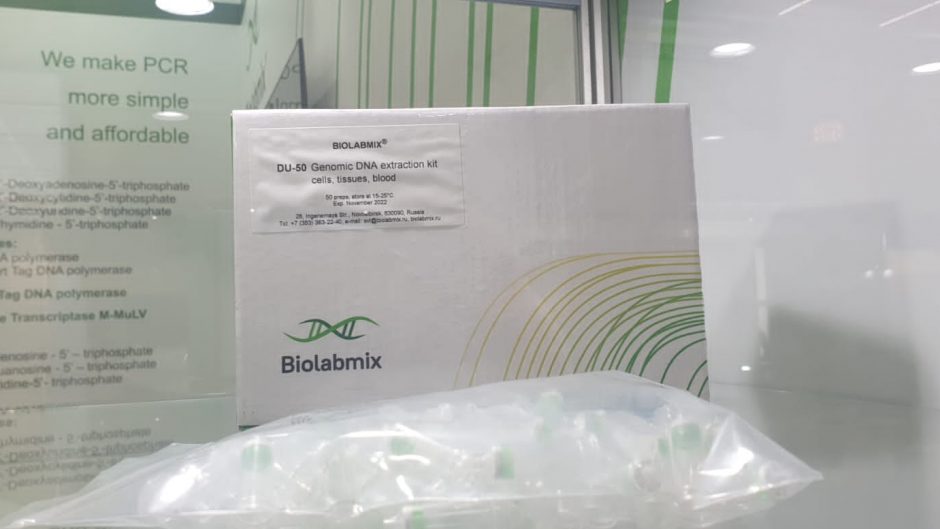
DU-50 Genomic DNA Extraction Kit cells, tissues, blood

Process any sample at any scale

Our wide range of genomic DNA extraction kits are grouped here by sample type, so you can easily find the best DNA extraction kit for your needs. Regardless of sample type, you can expect high yields and high-quality DNA to use in your downstream applications.

Our products cover a variety of performance options and processing methods, giving you flexible options. If you want to run fewer than 24 samples at a time, choose from our manual single-prep solutions. If you’re looking for an automated solution, our cartridge-based kits for use with Maxwell® Instruments can process up to 48 samples in the same run. We also offer kits designed for fully automated plate-based processing methods.

DNA Purification Kits

Classic DNA Purification Kits use a silica resin to tightly bind DNA under high-salt conditions, allowing proteins, small RNAs, and other molecules to be removed by washing steps with a salt/ethanol solution. After washing, the purified DNA is eluted in water or TE buffer. A broad portfolio of GenElute™ DNA purification kits tailored to specific sample types is available, enabling purification of genomic DNA (gDNA) from cell culture, mammalian tissue, blood, bacteria, viruses, plant tissue, soil, water, urine and faeces.

GenElute™ Cell-Free DNA Kits provide rapid and efficient purification of circulating free DNA (cfDNA) to recover cell-free DNA fragments in the 100 bp to 500 bp range, suitable for a wide range of downstream applications, including next-generation sequencing, qPCR and bisulfite sequencing.

Characteristics:

  • Silica-based DNA purification method
  • High-purity, high-yield DNA at the lowest cost per preparation
  • Most common technique used for DNA purification in laboratory workflows
  • ~90 min protocol (varies based on lysis time)
  • The complete portfolio of kits tailored to specific sample types
  • Vacuum and spin formats
  • Multi-analyte (RNA/DNA dual co-purification kits) available

Evaluation of DNA extraction

  • Spectrophotometer and Qubit Measurements.

The purity of the DNA extracted with each method was evaluated using an Eppendorf photometer. The absorbance ratio at 260 nm and 280 nm was used to assess protein contamination, while the absorbance ratio at 260 nm and 230 nm was calculated to assess guanidine contamination. Both spectrophotometric measurements constituted criteria for the evaluation of DNA quality with higher values ​​associated with better DNA purity. The amount of DNA extracted by the different methods was evaluated using the Qubit 2.0 fluorometer (Invitrogen, Life technologies).

The Qubit fluorometer calculates the concentration based on the fluorescence of a dye that binds to double-stranded DNA (dsDNA). The Qubit fluorometer captures this fluorescence signal and converts it to a measure of DNA concentration using DNA standards of known concentration. The Qubit dsDNA BR assay kit was used for DNA quantification. Based on the DNA concentration derived from the Qubit measurements and the volume of the DNA extract, the total DNA yield was calculated with a simple multiplication.

  • Gel electrophoresis.

The integrity of the DNA extracted by each method was assessed by gel electrophoresis. Specifically, 1 μl of each DNA extract was analyzed on a 1.5% agarose gel containing 0.5% ethidium bromide and visualized by U.V. illumination.

  • Real-time PCR.

Real-time PCR targeting the ovine prion protein (PRNP) gene was used to assess the presence of amplifiable DNA in blood sample extracts. The set of primers (which amplify a 168 bp PRNP genomic region), amplification reaction setup and thermocycling conditions described in a previous study were also applied here. Ct values ​​were used to assess the amount of amplifiable DNA obtained. In this regard, smaller Ct values ​​are desirable.

A second real-time PCR protocol was applied to assess the ability of different genomic DNA extraction protocols to remove PCR inhibitors from blood samples. The presence of PCR inhibitors in genomic DNA extracts was tested by adding 1000 bacterial genomic copies of DNA (Campylobacter coli C. coli, strain ATCC 43478) to 100 ng and 1000 ng sheep DNA extracts, respectively, followed by real-time PCR amplification. of the hydroxymethyltransferase (GLA) gene. Real-time PCR amplifications were performed with a Biorad CFX96 real-time system.

All samples were tested in triplicate, while three controls containing only the C. coli DNA tip (no sheep DNA) were included in each PCR test. The Ct values ​​obtained in the process were used to evaluate the presence of PCR inhibitors. Specifically, the resulting inhibition of amplification was evaluated in comparison to the unenriched control.